Nick Clegg says put the burden on the richest, but who is hurting from efforts to reduce the deficit
Neil MacDonald, economics producer, has been crunching the numbers on Nick Cleggs’ claims on the deficit earlier today.
Responding to a question about who should bear the burden of reducing the deficit, Nick Clegg said it should be spread as evenly as possible but it should start with the richest.
IFS analysis of the Coalitions changes cast doubt on whether either of those ideas were achieved by the Coalition.
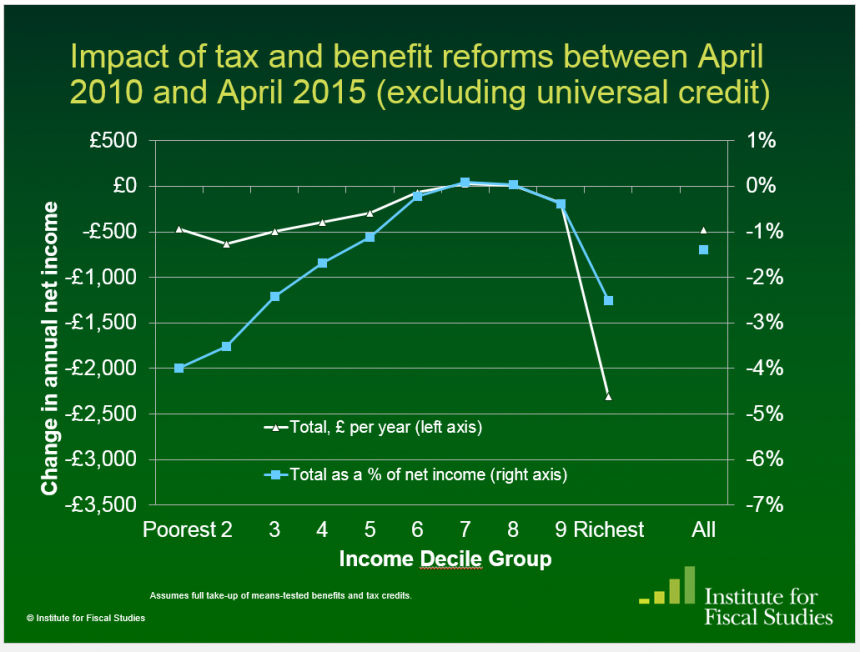
This chart shows the impact of all the tax and benefit changes (excluding Universal Credit reform) implemented since April 2010.

Two points I’d note:
The white line shows the cash lost by each income decile of the population. The top 10% have lost the most in cash terms (as Mr Clegg would want) but the next biggest losers in cash terms are the bottom three income deciles. They have all been hit by the squeeze on benefits. Bizarrely, people in the 7th and 8th income deciles have basically got away with no loss at all*. They’ve been helped in particular by the Lib Dem signature policy of raising personal allowances.
The blue line shows the same thing in a slightly different way – it shows the cash lost as a percentage of that group’s income. This is worth looking at because £500 a year lost by the poorest tenth of the population can matter more to them than £1,000 lost by the richest tenth. Here, the biggest losers are the bottom twenty percent of the population – they lost a bigger share of their income than even the top ten percent. Again, the people in the upper middle are the big winners on this analysis.
*To get into the 7th decile of income distribution, a single person would have an income of £18,338. A couple with one child would need an income of £37,352.
